Canonical Correlation Analysis
Description
CCA
Wine Data-set
Latent Variables
Loadings
Correlation Circles
Wine data set
We illustrate CCA on a wine tasting data set.
These data describe thirty-six red, rosé, or white wines produced in three different countries (Chili, Canada, and USA) using several different varietal of grapes. These wines are described by two different sets of variables. The first set of variables (i.e., matrix \(\X\)) describes the objective properties of the wines: Price, Acidity, Alcohol content, Sugar, and Tannin (in what follows we capitalize these descriptors).
The second set of variables (i.e., matrix \(\Y\)) describes the subjective properties of the wines as evaluated by a professional wine taster and consists in ratings on a 9-point rating scale of 8 aspects of taste: fruity, floral, vegetal, spicy, woody, sweet, astringent, acidic, plus an overall evaluation of the hedonic aspect of the wine (i.e., how much the taster liked the wine).
The dataset can be loaded from the csv file with the following command:
wine <- read.csv("DataWineR4CCA.csv")
The two blocks are defined as
X <- wine[, 4:8]
Y <- wine[, 9:17]
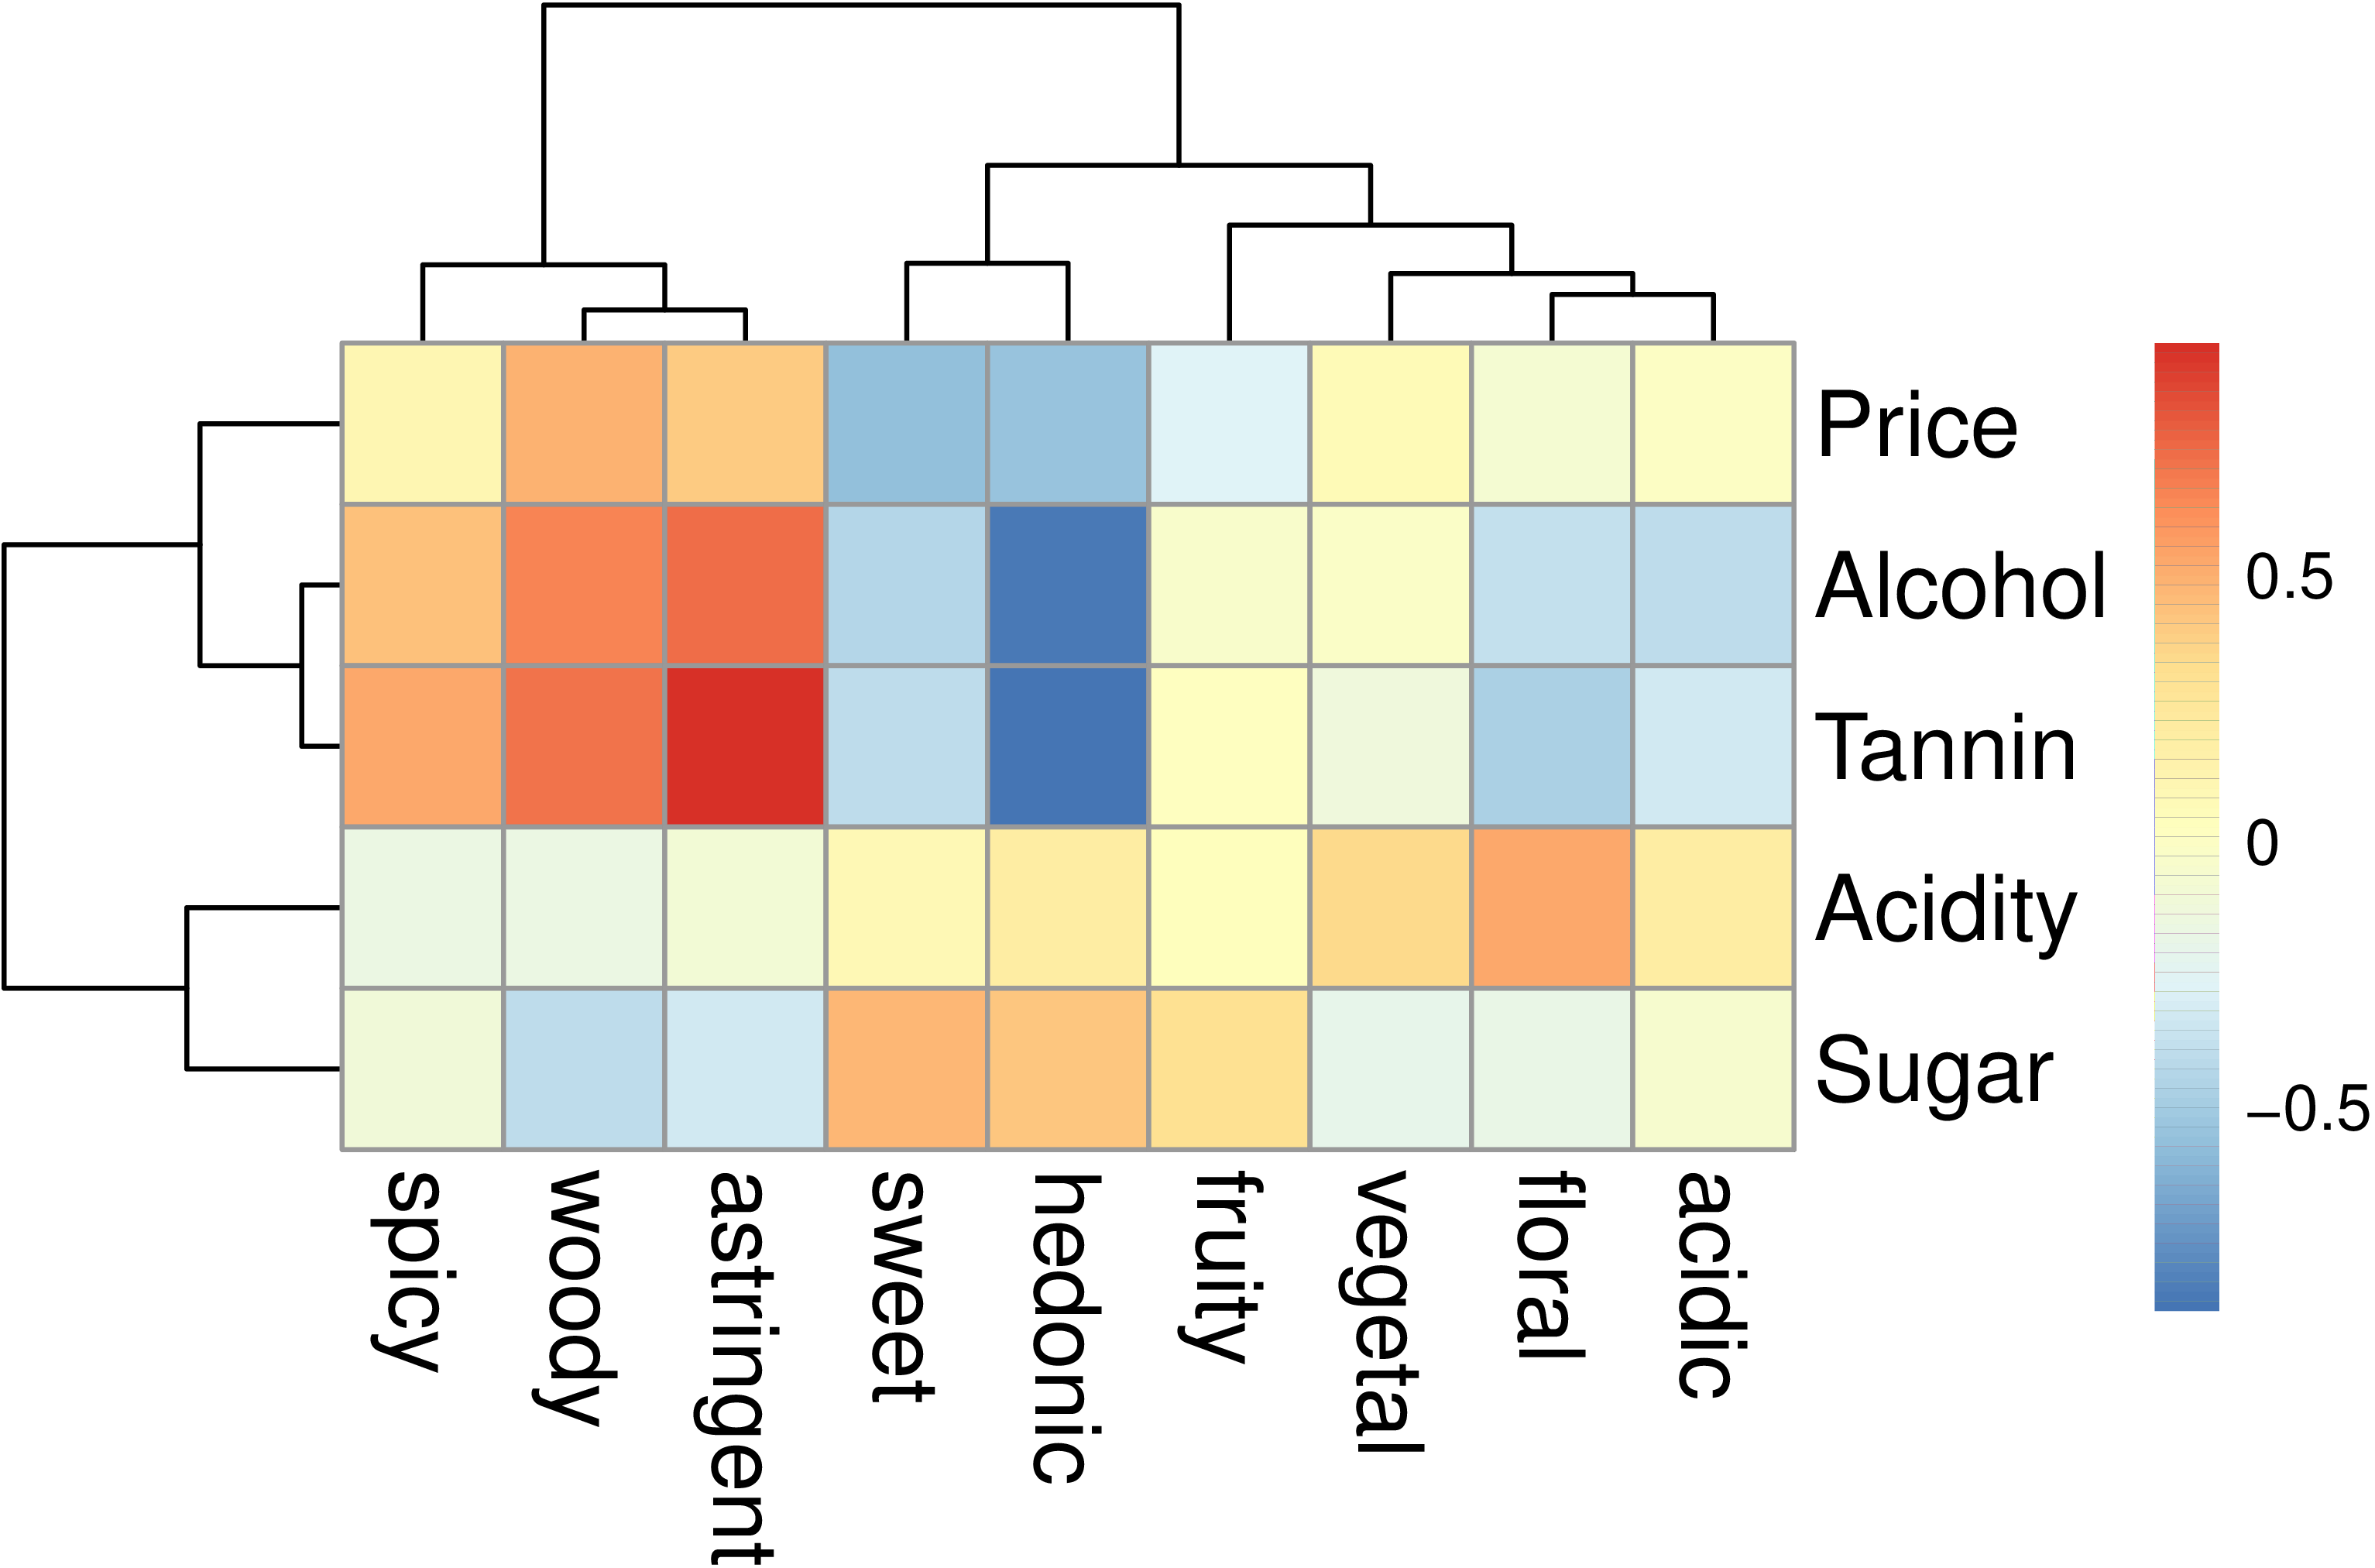
As shown in the following Figure (for matrix \(\R\), the correlation matrix between the variables of the two blocks), the objective variables Alcohol and Tannin
are positively correlated with the perceived qualities of astringent and
woody; by contrast, the perceived hedonic aspect of wine is negatively
correlated with Alcohol, Tannin
(and Price, so our taster liked inexpensive wines\dots)
and positively correlated with the Sugar content of the wines.
Unsurprisingly, the objective amount of Sugar is correlated with the perceived quality sweet.

This Figure was produced with the function pheatmap::pheatmap:
R <- cor(X, Y)
require(pheatmap)
pheatmap(R)